
According to the 2018 Federal Contracting Outlook issued by Bloomberg Government, there are some new trends related to the government procurements that prospects and contractors can expect.
“Federal government contractors should be optimistic with the uptick in spending that the federal government has experienced since 2012 and is expected to continue throughout 2018,” said Donald Thomas, vice president and general manager at Bloomberg Government.
A great focus will be on innovative acquisition procedures, operational efficiencies, and IT modernization. This will simplify competition processes, facilitating contractors’ participation in the Federal Market. Three main anticipated trends include:
Information Technology Procurement
In 2018, changes are expected to be made in the way the government acquires IT products and services from contractors. The National Defense Authorization Act (Public Law 115-91) enactment will also enable funding allocations for IT modernization in federal agencies, aiming to improve efficiency. These financial resources prioritize the purchase of supplies and services that enhance performance while reducing expenses and risks.
Contractors that provide cloud migration and share services, cyber-security, agile development as well as database and software development solutions, may have more compulsions this year.
GSA IT and individual agency funds allow federal agencies to invest in long-term contracts, which may lead to larger, longer contracts for contractors and more importance to the best quality solutions.
Audit Services
The U.S. government has required financial statements from all agencies, which allows more space in contracting opportunities for companies that provide audit services.
Due to financial management problems, DOD has not been able to provide consolidated financial statements until recently. Last fall, Pentagon began preparing their first financial audit, which means that contractors with auditing expertise will have more business opportunities with Defense.
Mid-Tier Companies
Another trend of 2018 is the growth of mid-tier companies. Also defined by annual revenue between $25M and $500M, these companies will address structural procurement barriers including team restriction which will lead to expanded opportunities in the federal market and business growth.
Above we have outlined some of the trends that are expected to take place in the FY 2018. Following you can find summarized facts about the most successful state-based contractors for the first two quarters of 2018 and the most successful ones of the FY 2017. Moreover, we have listed the most successful contractor companies that were awarded the most lucrative contracts for FY 2015 and 2016.

The Most Awarded States in FY 2018
Although we’re only in the second quarter of fiscal year (FY) 2018, the Government has awarded a great number of contracts which we’re going to illustrate below.
The total number of transactions made until now is 930,001, contract awards reaching the dollar value of $86,420,809,661. These funding were distributed by Federal agencies through contracts, but, there are funds that they award through grants, loans, and other financial assistance.
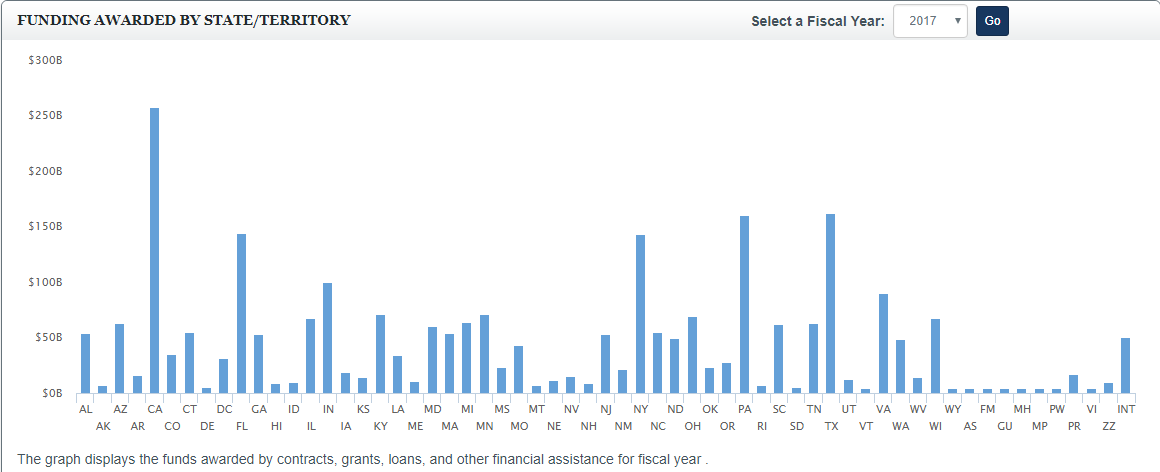
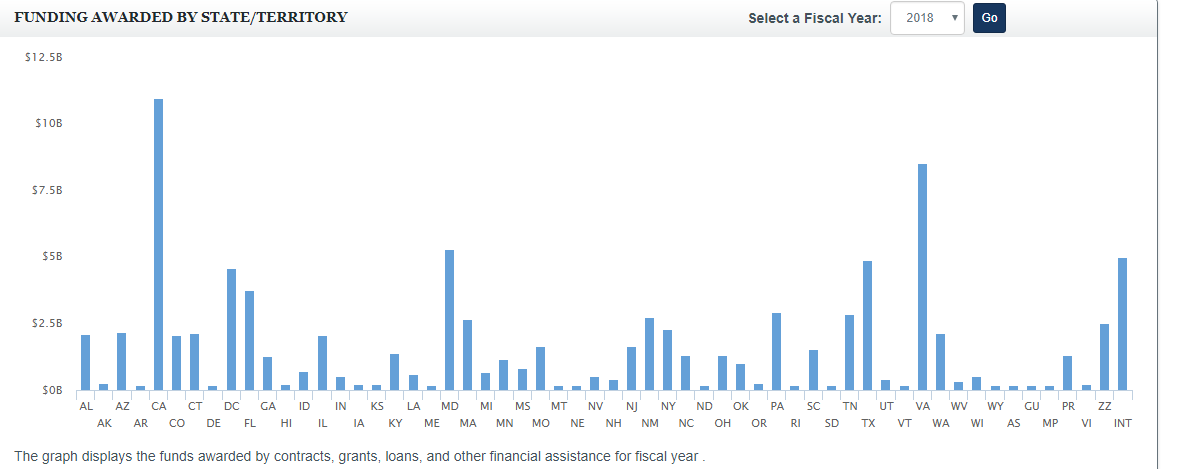
According to USA Spending, the leading state with the largest number of contracts won, as well as other financial aids for the year FY 2017 was California, followed by Texas, Pennsylvania, New York and Florida. Even though there’s half a year ahead, countries that have been awarded federal funding the most in FY 2018 are California, followed by Virginia, Maryland, Texas, and District of Colombia.
FY 2017 Top 10 Awarded States
Below you can see the total dollar amount funded by the Government through contracts, grants, and loans. You can see federal budget spending by state, and number of transactions.
| State | Funds Awarded | Number of Transactions |
| California | $257,500,542,364 | 509,831 |
| Texas | $162,038,946,961 | 394,613 |
| Pennsylvania | $160,004,453,479 | 617,372 |
| Florida | $143,815,845,329 | 262,752 |
| New York | $142,993,792,100 | 275,404 |
| Indiana | $100,172,740,472 | 118,932 |
| Virginia | $90,240,664,200 | 479,602 |
| Kentucky | $71,318,082,220 | 92,379 |
| Minnesota | $71,173,024,757 | 119,066 |
| Ohio | $69,121,818,438 | 170,294 |
Table 1. FY 2017 Top 10 Awarded States
https://www.usaspending.gov/transparency/Pages/StateSummaries.aspx
FY 2018 Top 10 States leading with funds awarded
Below you can see the total dollar amount funded by the Government through contracts and other financial assistance until the second quarter of the fiscal year.
| State | Funds Awarded | Number of Transactions |
| California | $10,952,441,466 | 64,519 |
| Virginia | $8,528,386,664 | 64,710 |
| Maryland | $5,290,557,290 | 29,462 |
| Texas | $143,815,845,329 | 51,610 |
| District of Columbia | $4,592,663,415 | 26,202 |
| Florida | $3,763,268,829 | 28,525 |
| Pensylvania | $2,939,320,794 | 84,596 |
| Tennessee | $2,865,350,374 | 7,886 |
| New Mexico | $2,733,387,113 | 4,809 |
| Massachusetts | $2,678,735,497 | 13,766 |
Table 2. FY 2018 Top 10 States leading with funds awarded
Source: https://www.usaspending.gov/transparency/Pages/StateSummaries.aspx